Schaltpunkte visualisieren mit R
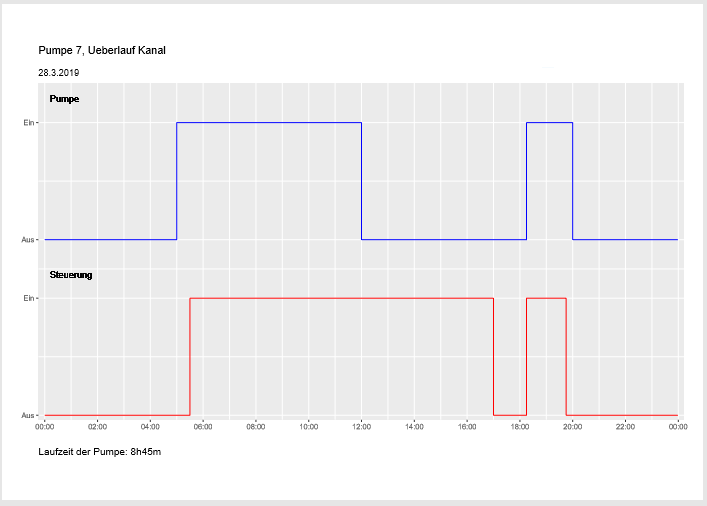
Ein Kunde wollte die Schaltpunkte einer Pumpe visualisieren, und zwar im Format A4 quer.
Mit Hilfe R und ggplot2 ist das gut zu machen, wie Sie hier sehen.
Die Datenquelle
Die Schaltpunkte werden aus einem CSV-File gelesen das folgenden Aufbau hat:
Zeit,Pumpe,Steuerung
00:00,0,0
05:00,1,0
05:30,1,1
12:00,0,1
17:00,0,0
18:15,1,1
19:45,1,0
20:00,0,0
23:59,0,0
In der ersten Spalte steht die Uhrzeit, in den weiteren Spalten ob der entsprechende Eingang aktiv oder inaktiv ist. 1 und 0 sind so festgelegt dass die Graphik bequem zu erstellen ist. Sie können auch andere Werte wählen, müssen aber die Y-Achse entsprechend anpassen.
Das R-Programm
Das Feintuning hat mich einige Zeit gekostet, studieren Sie den Code also ganz genau...
library( tidyverse )
library( hms )

# Load the csv in a data frame
df <- read_csv( "pump.csv")

# Add an offset to the pump values
df$Pumpe  <- df$Pumpe + 1.5

# Store the plot in a pdf, size A4, landscape orientation
pdf( "pump.pdf", paper="a4r", width=12, height=7 )

# Start the plot
plot <- ggplot( df, aes(x=Zeit) ) +
  # Add line for the pump
  geom_step(aes(y=Pumpe),color="blue") +
  # Add line for the controller
  geom_step(aes(y=Steuerung),color="red") +
  # Configure the x axis
  scale_x_time( labels = function(t) strftime(t,"%H:%M",tz="UTC"),
                breaks = seq(hms(0,0,0),hms(0,0,24),length.out=13),
                expand = c(0.01,0.01) ) +
  # Configure the y axis
  scale_y_continuous( limits = c(0,2.8), breaks = c(0,1,1.5,2.5),
                      labels=c("Aus","Ein","Aus","Ein"),
                      expand = c(0.01,0.01) ) +
  # Set options on the theme
  theme( axis.title.x = element_blank(), axis.title.y = element_blank(),
         plot.caption = element_text( size=12, hjust=0, margin=margin(20)),
         plot.title   = element_text( margin=margin(b=16) ) ) +
  # Add titles and caption
  labs( title="Pumpe 7, Ueberlauf Kanal",subtitle="28.3.2019",caption="Laufzeit der Pumpe: 8h45m") +
  # Add labels
  geom_text( x = hms(0,45,0),y = 2.7, label= "Pumpe") +
  geom_text( x = hms(0,0,1),y = 1.2, label= "Steuerung")

# Print the plot
print( plot )

# Close the plot
dev.off()